How to Read Crypto Charts: Candlesticks, RSI, MACD & Key Patterns Explained
A complete beginner-to-intermediate guide to technical analysis for crypto — candlestick anatomy, trend lines, support/resistance, and the three most useful indicators.

Technical analysis (TA) is the practice of using historical price data and chart patterns to forecast future price movements. It is not magic, and it is not always right — but it gives you a structured language for interpreting the market and managing risk. This guide covers everything you need to start reading crypto charts confidently.
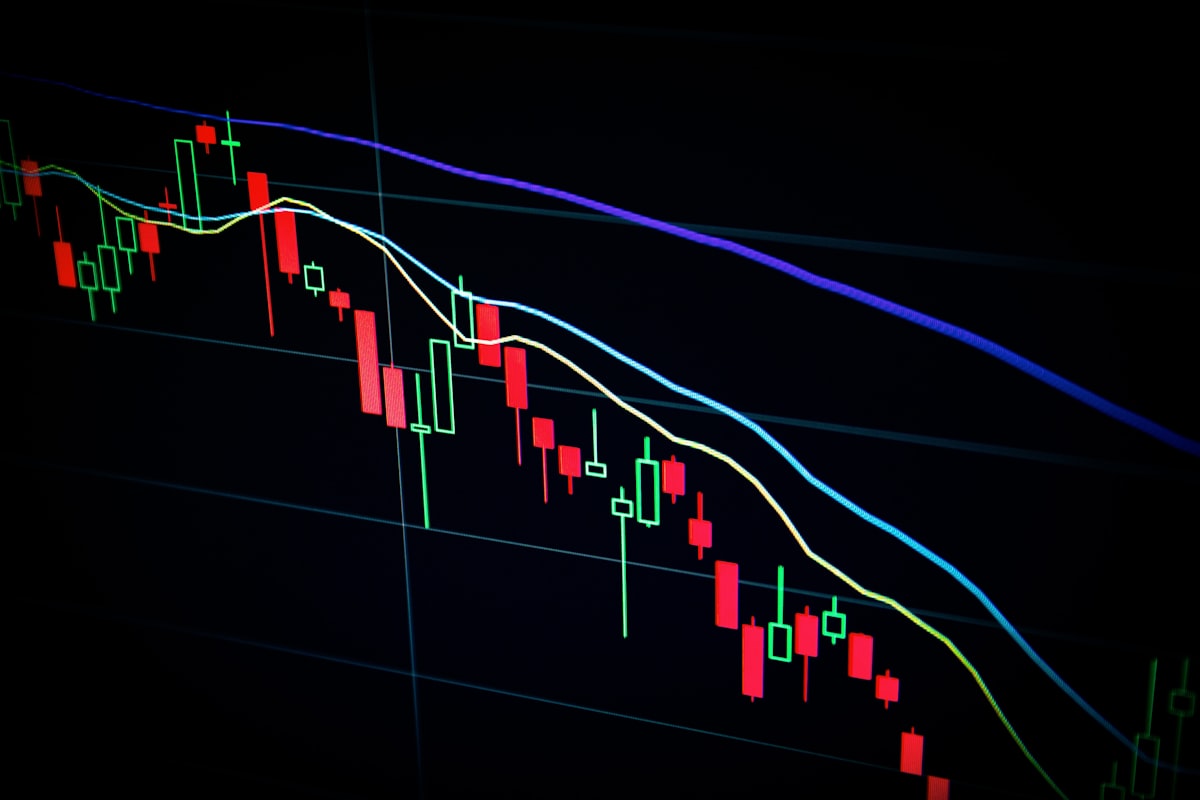
Start Here: A Live BTC Chart
Open the chart below and follow along as we explain each element:
1. Candlestick Anatomy
Every candle represents a time period (1h, 4h, 1d, 1w) and contains four data points:
| Part | What it shows | Key detail |
|---|---|---|
| Body (wide part) | Open and close price | Green body = close higher than open (bullish). Red = bearish. |
| Upper wick | Highest price reached | Long upper wick = selling pressure at highs — bears rejecting the move |
| Lower wick | Lowest price reached | Long lower wick = buying pressure at lows — bulls defending |
| Candle colour | Bullish or bearish close | Green/white = price rose. Red/black = price fell. |
Key Candlestick Patterns
| Pattern | What it looks like | Signal |
|---|---|---|
| Doji | Tiny body, long wicks both sides | Indecision — market undecided, watch for direction confirmation |
| Hammer | Small body at top, long lower wick | Bullish reversal signal after a downtrend |
| Engulfing bullish | Large green candle engulfs prior red | Strong bullish reversal — buyers overwhelmed sellers |
| Engulfing bearish | Large red candle engulfs prior green | Strong bearish reversal — sellers overwhelmed buyers |
| Shooting star | Small body at bottom, long upper wick | Bearish reversal — price was rejected at highs |
2. Support & Resistance
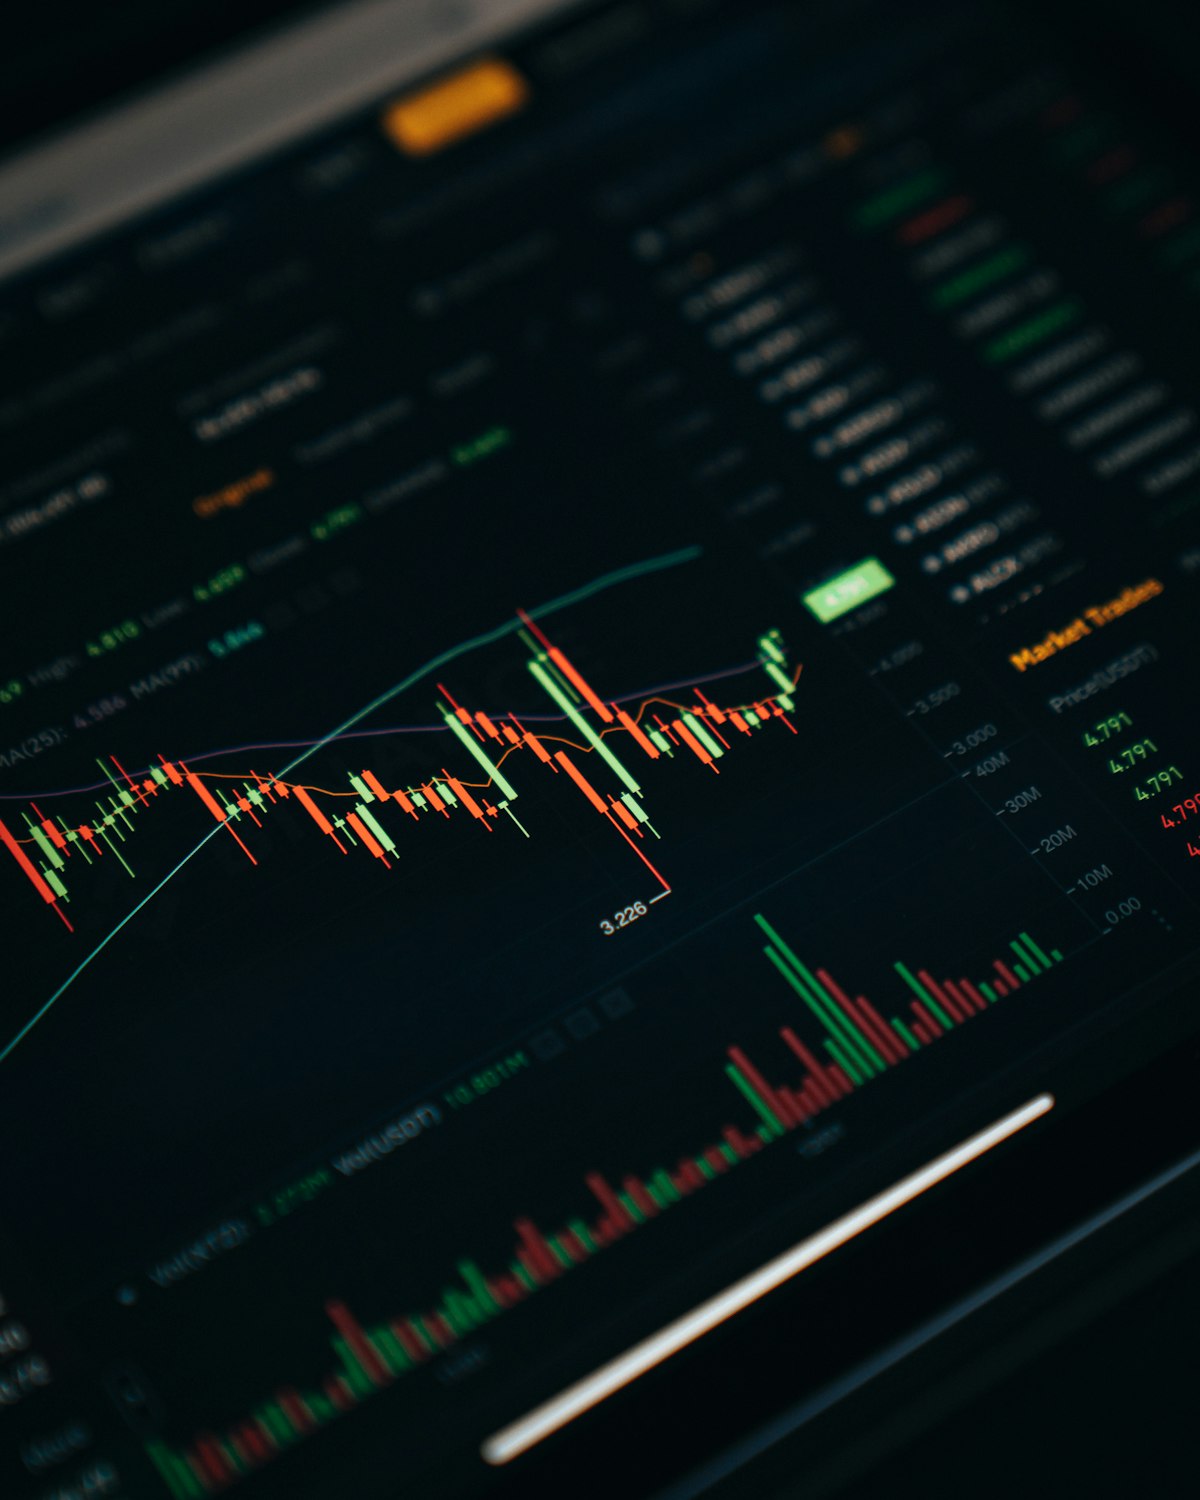
Support is a price level where buyers historically step in (price bounces up). Resistance is a level where sellers dominate (price gets rejected). These levels form because human psychology repeats: people buy where they previously bought, and sell where they previously made profit.
How to identify them: Look for price levels that have been tested multiple times. The more times a level holds, the stronger it is. When support breaks, it often becomes resistance — and vice versa.
3. The Three Most Useful Indicators
RSI — Relative Strength Index
| RSI Reading | Zone | Meaning |
|---|---|---|
| 0 – 30 | Oversold | Market has sold off hard — watch for reversal, but trend can continue |
| 30 – 50 | Bearish territory | Below midline = selling pressure dominates |
| 50 – 70 | Bullish territory | Above midline = buying pressure dominates |
| 70 – 100 | Overbought | Rally may be overextended — not a sell signal alone, but watch closely |
MACD — Moving Average Convergence/Divergence
MACD measures the relationship between two exponential moving averages (12 and 26 period by default). When the MACD line crosses above the signal line → bullish. When it crosses below → bearish. The histogram shows the momentum of the crossover.
Volume
Always check volume. A breakout on low volume is suspect — it may reverse. A breakout on high volume has conviction. Volume is the one indicator that never lies: it shows how many people are actually participating in a move.
Timeframes — Which to Use
| Timeframe | Best for | Noise level |
|---|---|---|
| 1-minute / 5-minute | Scalp trading (not recommended for beginners) | Extremely high |
| 1-hour | Short-term swing trades (1–3 days) | High |
| 4-hour | Medium-term analysis, entry timing | Medium |
| Daily | Standard swing trading, trend identification | Low |
| Weekly | Long-term macro trend analysis, cycle positioning | Very low |
Watch: How to Read Crypto Charts for Beginners (2025)
Ready to apply this? Run the analysis on the charts in our Bitcoin price analysis or explore the top 5 altcoins. For portfolio strategy, read the DeFi vs CeFi guide.
Written by
ssassam
Crypto analyst and financial writer covering blockchain technology, DeFi, and digital asset markets since 2017. Specialises in Bitcoin on-chain metrics, altcoin fundamentals, and technical chart analysis.
Related posts

Crypto
DeFi vs CeFi: Which Crypto Strategy is Right for You in 2025?
May 12, 2026 · 3 min read
Decentralised vs centralised finance in crypto — yields, risks, platforms, custody, and a head-to-head comparison to help you choose the right approach.
Read more →
Crypto
Top 5 Altcoins to Watch in 2025: ETH, SOL, BNB, AVAX & LINK Analysed
May 12, 2026 · 3 min read
Live charts, technical analysis, tokenomics and risk ratings for the five altcoins with the strongest fundamental and technical setups in 2025.
Read more →
Crypto
Bitcoin Price Analysis 2025–2026: Key Levels, On-Chain Data & Forecast
May 12, 2026 · 2 min read
A deep technical and on-chain analysis of Bitcoin — support/resistance levels, RSI, MVRV, halving cycle position, and what analysts expect next.
Read more →