Bitcoin Price Analysis 2025–2026: Key Levels, On-Chain Data & Forecast
A deep technical and on-chain analysis of Bitcoin — support/resistance levels, RSI, MVRV, halving cycle position, and what analysts expect next.

Bitcoin’s price action never happens in isolation. Every move is the sum of macro liquidity conditions, miner economics, on-chain accumulation patterns, and the sentiment of millions of market participants. This analysis layers all of those lenses onto the current chart.
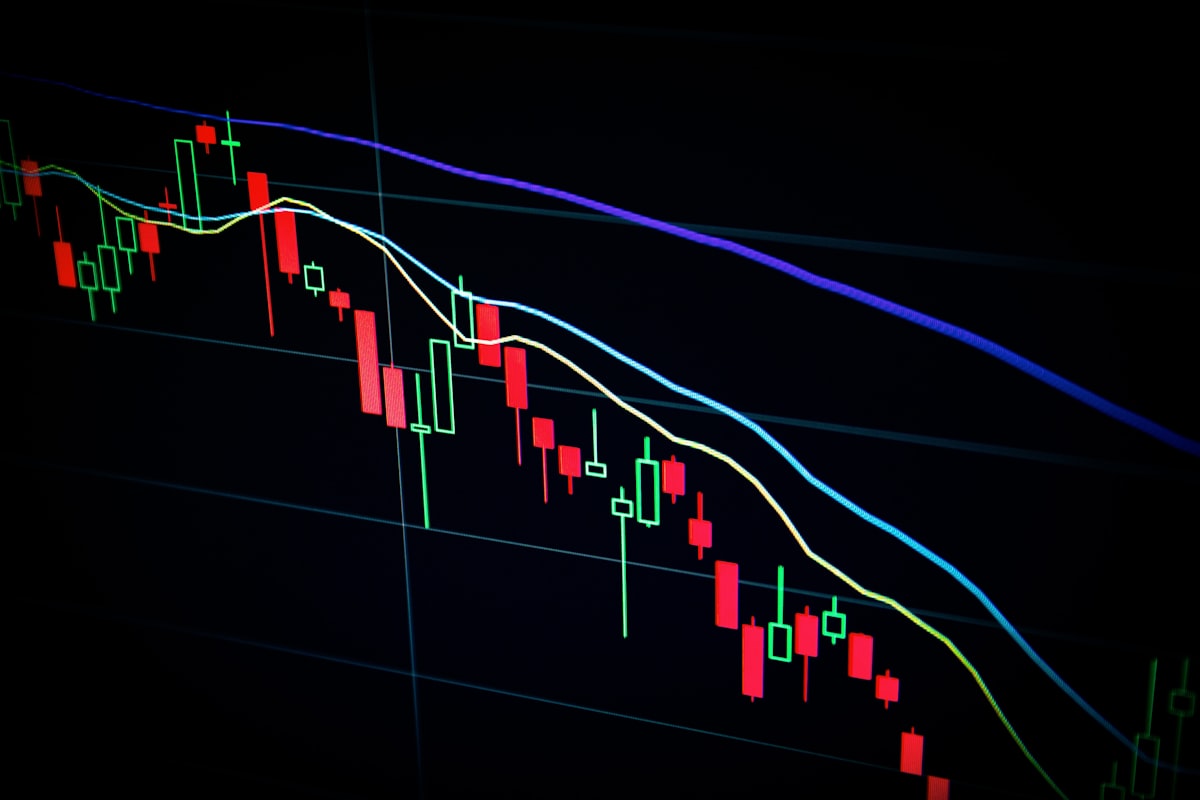
BTC/USD — Weekly Chart with RSI
Key Support & Resistance Levels
| Level | Price Zone | Significance | Type |
|---|---|---|---|
| Major resistance | $108,000 – $112,000 | ATH region + 2021 cycle projection | Resistance |
| Resistance | $95,000 – $100,000 | Round-number psychological + prior ATH | Resistance |
| Current range | $82,000 – $88,000 | Near-term consolidation band | Range |
| Support 1 | $72,000 – $76,000 | 2024 pre-election breakout level | Support |
| Support 2 | $60,000 – $65,000 | 2024 accumulation zone + halving base | Strong support |
| Deep support | $40,000 – $45,000 | 200-week moving average zone | Historic floor |
Technical Indicators Summary
| Indicator | Current Reading | Signal | Notes |
|---|---|---|---|
| RSI (14) | 58 – 62 | 🟡 Neutral | Room to run before overbought (>70) |
| MACD | Bullish crossover | 🟢 Bullish | Histogram expanding above zero |
| 200-week SMA | ~$42,000 | 🟢 Bullish | Price well above long-term average |
| Pi Cycle Top | Not triggered | 🟢 Bullish | No sell signal from this indicator |
| Puell Multiple | 1.1 – 1.4 | 🟡 Neutral | Miner revenue healthy; not overheated |
| Funding rate | Near neutral | 🟢 Healthy | No excessive long leverage |
On-Chain Analysis

| Metric | Value | Interpretation |
|---|---|---|
| MVRV Z-Score | 2.1 | Below 6 = not overvalued; cycle still has room |
| HODL waves >1yr | ~70% | Majority of supply held by strong hands |
| Exchange reserves | Declining trend | Supply leaving exchanges = accumulation signal |
| Long-term holder supply | Near all-time high | LTHs not selling despite price recovery |
| Hash rate | All-time high | Network security strongest ever; miner confidence |
| NVT ratio | 55 – 65 | Fair value range — not extended |
Halving Cycle Position
Bitcoin’s April 2024 halving reduced block rewards from 6.25 to 3.125 BTC. Historically, the 12–18 months post-halving represent the strongest price appreciation phase:
| Halving | Date | Pre-halving price | Cycle peak | Peak gain |
|---|---|---|---|---|
| 1st halving | Nov 2012 | $12 | $1,150 | +9,483% |
| 2nd halving | Jul 2016 | $650 | $19,800 | +2,969% |
| 3rd halving | May 2020 | $8,600 | $68,800 | +700% |
| 4th halving | Apr 2024 | $63,000 | In progress | TBD |
Watch: Bitcoin 2026 Forecast — Analyst Ben Cowen
Analyst Price Targets (2025–2026)
| Analyst / Firm | Target | Timeline | Basis |
|---|---|---|---|
| Standard Chartered | $120,000 | End-2025 | ETF flows + halving cycle |
| ARK Invest | $150,000+ | 2025–2026 | Bitcoin Big Ideas report |
| PlanB (S2F model) | $100,000 – $500,000 | Cycle peak | Stock-to-Flow model |
| Ben Cowen | $80,000 – $110,000 | Mid-2025 | ISM cycle + rate cuts |
| JPMorgan | $45,000 – $60,000 | 2025 | Production cost model — conservative |
For the broader crypto picture, see our Bitcoin vs Ethereum comparison and our top 5 altcoins analysis. New to reading charts? Start with our technical analysis guide.
Written by
ssassam
Crypto analyst and financial writer covering blockchain technology, DeFi, and digital asset markets since 2017. Specialises in Bitcoin on-chain metrics, altcoin fundamentals, and technical chart analysis.
Related posts

Crypto
DeFi vs CeFi: Which Crypto Strategy is Right for You in 2025?
May 12, 2026 · 3 min read
Decentralised vs centralised finance in crypto — yields, risks, platforms, custody, and a head-to-head comparison to help you choose the right approach.
Read more →
Crypto
How to Read Crypto Charts: Candlesticks, RSI, MACD & Key Patterns Explained
May 12, 2026 · 3 min read
A complete beginner-to-intermediate guide to technical analysis for crypto — candlestick anatomy, trend lines, support/resistance, and the three most useful indicators.
Read more →
Crypto
Top 5 Altcoins to Watch in 2025: ETH, SOL, BNB, AVAX & LINK Analysed
May 12, 2026 · 3 min read
Live charts, technical analysis, tokenomics and risk ratings for the five altcoins with the strongest fundamental and technical setups in 2025.
Read more →